Spotify Generational Music Trends
Link to GitHub Repository
Introduction
My immediate family is stretched across 3 different "generations." My parents are both proud Baby Boomers
while my older brother is a Millennial and I am a Gen Z. Years and dates aren't necessary for you to understand that there
are some age gaps between the four of us. Although golf, dogs, and home-cooked meals make those age gaps seem
much smaller, the four of us all seem to have somewhat distinct music tastes.
In this data analysis project, I explore generation-defining music and attempt to use Spotify audio features to figure out what musical attributes are most appealing to each generation. However, as a violinist and music fan myself, I understand that numbers simply cannot quantify every characteristic in existence — especially when it comes to something as subjective as music.
Research and Sampling Methods
Before beginning data collection, I firstly defined the generations being analyzed. For this project, I am going to explore
Baby Boomers (born between 1946-1964), Generation X (1965-1980), Millennials/Generation Y (1981-1996), and Generation Z
(1997-2012). According to Google, these are the birth years generally considered for each generation.
Next, I began to puruse popular music for each generation. (Note that "popular music" here does not necessarily mean pop music; I am referring to music that each generation liked to listened to and/or music that was popularized by a generation). Some of the articles that I found listed 10 songs that were popular at the time for each generation. While I could have used songs as the basis for this project, my sample sizes for each generation would have been miniscule. Also, it was hard to find top song lists that stretched an entire generation. Additionally, 10 songs are not necessarily representative of a whole generation's worth of popular music. Another route for collecting data could be selecting specific artists and using all of their music. Again, this would be a viable solution. However, it would run the risk of including music enjoyed by a different generation (leading to overlap) or including an artist that may have had a one hit wonder.
After careful consideration, I eventually settled on finding the top 10 popular albums from each generation. It seemed to be the best of both worlds, considering that it captured a group of popular songs from an artists, but still allowed for artists with only a few popular songs. Additionally, songs for albums could include several singles that were released over a period of time. It is also reasonable to assume that albums include at least 5 to 8 songs, generating a sample of 50 to 80 songs per generation.
Altogether, I explored 601 songs with 142 from the Baby Boomer generation, 200 from Generation X, 110 from Millennials, and 149 from Generation Z.
Below is a table of the albums that I analyzed and sources for each of these lists are linked in their respective column headers:
| Baby Boomers | Generation X | Millennials | Generation Z [1] [2] |
|---|---|---|---|
| Highway 61 Revisited (1965) by Bob Dylan | Nevermind (1991) by Nirvana | Oops!…I Did It Again (2000) by Britney Spears | My Beautiful Dark Twisted Fantasy (2010) by Kanye West |
| Sgt. Pepper's Lonely Hearts Club Band (1967) by The Beatles | Ten (1991) by Pearl Jam | Bleed American (2001) by Jimmy Eat World | Lemonade (2016) by Beyoncé |
| What's Going On (1971) by Marvin Gaye | The Chronic (1992) by Dr. Dre | Under My Skin (2004) by Avril Lavigne | To Pimp a Butterfly (2015) by Kendrick Lamar |
| Tapestry (1971) by Carole King | OK Computer (1997) by Radiohead | Enema of the State (1999) by blink-182 | Red (2012) by Taylor Swift |
| Led Zeppelin IV (1971) by Led Zeppelin | The Battle of Los Angeles (1999) by Rage Against the Machine | Stripped (2002) by Christina Aguilera | When We All Fall Asleep, Where Do We Go? (2019) by Billie Eilish |
| Exile on Main St. (1972) by The Rolling Stones | Sublime (1996) by Sublime | Try This (2003) by P!nk | Scorpion (2018) by Drake |
| Innervisions (1973) by Stevie Wonder | Blood Sugar Sex Magik (1991) by Red Hot Chili Peppers | American Idiot (2004) by Green Day | Melodrama (2017) by Lorde |
| Eagles: Their Greatest Hits 1971–1975 (1976) by Eagles | Out of Time (1989) by R.E.M. | The Eminem Show (1992) by Eminem | 21 (2011) by Adele |
| Exodus (1977) by Bob Marley & the Wailers | Tragic Kingdom (1995) by No Doubt | Backstreet Boys (1997) by Backstreet Boys | thank u, next (2019) by Ariana Grande |
| Saturday Night Fever: The Original Movie Sound Track (1977) by Various Artists | Mellon Collie and the Infinite Sadness (1995) by Smashing Pumpkins | From Under the Cork Tree (2005) by Fall Out Boy | My World 2.0 (2010) by Justin Bieber |
Data Collection and Analysis
After gathering this list of albums, I began to research and learn the Python API Spotipy. This is a tool that allows me to
connect some Python source code to
Spotify's Web API. This tool would not
only serve as a means of collecting all of the song titles, but also as my source of analysis. Spotify's Web API has audio
track features that quantify characteristics of each song, such as the amount of spoken words and use of instruments rather
than electronic synthesizers. On the
Spotify API documentation, there are 13 quantified characteristics defined:
Acousticness,
Danceability,
Duration,
Energy,
Instrumentalness,
Key,
Liveness,
Loudness,
Mode,
Speechiness,
Tempo,
Time Signature, and
Valence.
While most of these attributes measure a specific characteristic of music, a couple of them do overlap. For instance, Mode and Key both measure types of key signatures. Key is more specific whereas Mode is either major or minor. Since it has been proven that people generally like songs in major keys rather than minor keys, I decided to only analyze Mode. Another example is Tempo and Time Signature. Time Signature specifies the number of beats in a measure, but Tempo specifies how fast those beats are played. As a result, I decided to only analyze Tempo. I also decided to not look into Liveness since this attribute evaluates the presence of an audience in a track. I personally did not want to look into this and also because all of my tracks have been produced or re-produced in a studio with no audience. Lastly, the final attribute I decided to not include in this project is Loudness. The reason being is because as a violinist, I was taught that loudness does not impact whether or not music is good; the quality of music is dependent on other variables, which are better demonstrated by the other attributes. The remaining 10 attributes are defined in my findings.
Next, I wrote some Python code that gathered all of these songs, their respective track attributes, and printed them in the console for me to transfer to CSV files for each generation. Of course, before proceeding to the analysis part of this project, I spell-checked the output and removed any commas. These CSV files, as well as the Python code for sifting through the API's output, can all be found on my GitHub repository which is linked at the top of the page.
The analysis portion of this project took place in R. I learned about R in my MATH 352 Statistical Data Analysis course. I used the CSV files and imported them into the R workspace to run One Sample t-tests to find 95% confidence intervals, Welch Two Sample t-tests in which the variances are not equal, and Pearson's Product-Moment Correlation tests with a variety of alternative hypotheses (greater, less, and equal to 0). I also did some linear regression and Nested F Tests in R. All of my tests were performed with α = 0.05 and can be found on my GitHub repository. Lastly, while I do point out specific minimums, maximums, etc. in my findings, I am not going to list all of the songs with those scores since many songs have the same or similar ratings.
Findings
AcousticnessA confidence measure from 0.0 to 1.0 of whether the track is acoustic. 1.0 represents high confidence the track is acoustic.

95% confidence intervals
[3]:
Baby Boomers (BB): 0.5007412 to 0.5839052
Generation X (X): 0.1355868 to 0.2163487
Millennials (M): 0.1566540 to 0.2242059
Generation Z (Z): 0.1754778 to 0.2643547
Across all 4 generations, here are some other statistics that are noteworthy:
Minimum: 3.69e-06 (There are 10 songs with this acousticness rating)
Maximum: 0.947 (2)
Average: 0.2760703 (0)
Median: 0.159 (9)
As demonstrated by the graph, Baby Boomer music has significantly higher Acousticness (or the least amount of electric amplification) than any other generation. Generation Z music had the second-highest score for Acousticness. However, the Acousticness score for Generation Z is not statistically greater than Millennials or Generation X. In other words, music enjoyed by Generation Z, Millennials, and Generation X generally have a similar level of Acousticness. This conclusion is supported by the 95% confidence intervals, as these intervals for Generation Z, Millennials, and Generation X overlap.
Looking at the graph and confidence intervals, I am not surprised by the Baby Boomer music's Acousticness scores. However, I am surprised by Generation Z. Considering how more and more technology has been integrated into music production, I was anticipating Generation Z to have one of the lower Acousticness averages, along with Millennials. On the other hand, since Generation X had drastically lower Acousticness than the Baby Boomers, then perhaps popular Millennial and Generation Z music artists wanted to decrease the amount of electric amplification to pay homage to some of the musicians they looked up to.
As for Generation X, I am also a bit surprised at how low the Acousticness average is. The musicians popularized by Baby Boomers and Gen Xers both include a fair amount of bands (in particular, rock bands). Perhaps this stark difference is due to when commercial guitar amps were invented, which was in 1947. [4]
Danceability describes how suitable a track is for dancing based on a combination of musical elements including tempo, rhythm stability, beat strength, and overall regularity. A value of 0.0 is least danceable and 1.0 is most danceable.
95% confidence intervals:
BB: 0.4494100 to 0.4833928
X: 0.5011524 to 0.5563776
M: 0.6951098 to 0.7401993
Z: 0.4937239 to 0.5338332
Across all 4 generations, here are some other statistics that are noteworthy:
Minimum: 0.25 (4)
Maximum: 0.905 (9)
Average: 0.5448869 (0)
Median: 0.504 (10)

All four generations appear to have relatively similar Danceability scores, but Millennial music has the greatest on average. Next, Generation X and Z both have comparable Danceability and do not differ significantly from each other since their confidence intervals have some overlap. However, Baby Boomer music has a statistically lower Danceability rating than all of the other generations. The Baby Boomer confidence interval for Danceability does not even coincide with Generation Z's, which has the second lowest Danceability average.
I was surprised by the results for this track attribute. Having heard some of my parents' favorite music, I was under the impression that Baby Boomer music was the most "danceable." However, it ranked very low compared to all of the other generations. On the other hand, Millennials had the highest ranked Danceability, with Generation X and Z falling in between.
As for further exploration, I ran a correlation test between each generation's Danceability and Tempo track attributes (since Spotify claims tempo affects Danceability). Across all 4 generations, Danceability and Tempo are inversely related. For Baby Boomers, the correlation coefficient r = -0.2303871 and the p-value = 0.00581; for Generation X, r = -0.3595551 and p-value = 1.705e-07; for Millennials, r = -0.6470702 and p-value = 2.216e-14. As for Generation Z, r = -0.03936581 and p-value = 0.6336, which strangely, suggests there is no relationship between Danceability and Tempo.
This relationship is weak for Baby Boomers, but moderate to strong for all other generations. Tempo will be explained later on in this article, but the average tempo for all generations is around 118 BPM. I speculate a song's Danceability decreases when the tempo is too slow and too fast, with the "sweet spot" being centered around Millennial's confidence interval for tempo, 107 to 114 BPM. This particular question will be further explored in the Tempo section.
The duration of the track in milliseconds.

95% confidence intervals:
BB: 257253.5 to 303092.0 (4.3 to 5.05 minutes)
X: 211100.5 to 228049.5 (3.5 to 3.8 minutes)
M: 217707.1 to 229793.6 (3.6 to 3.8 minutes)
Z: 287314.1 to 326335.5 (4.8 to 5.4 minutes)
Across all 4 generations, here are some other statistics that are noteworthy:
Minimum: 62253 or 1.03 minutes (10)
Maximum: 681400 or 11.3 minutes (10)
Average: 256287.8 or 4.2 minutes (0)
Median: 230933 or 3.8 minutes (9)
As depicted in the graph, there appears to be 2 generations with lengthier music and 2 generations with shorter music. On average, Generation Z tends to have longer songs than all the other generations, with an average of 5.1 minutes. Baby Boomers have songs with an average of 4.6 minutes, but this is statistically lower than Generation Z's music, as the overlap between these two generations is minimal. Millennials and Generation X both have similar length songs with average durations of 3.7 minutes and 3.6 minutes respectively.
The length of a song has many different factors, but I think it's unlikely that musicians have a target song duration in mind when songwriting. Therefore, in addition to not having any other data, I did not feel the need to further analyze or speculate why the average durations of these generations' songs differ.
Energy is a measure from 0.0 to 1.0 and represents a perceptual measure of intensity and activity. Typically, energetic tracks feel fast, loud, and noisy. For example, death metal has high energy, while a Bach prelude scores low on the scale. Perceptual features contributing to this attribute include dynamic range, perceived loudness, timbre, onset rate, and general entropy.
95% confidence interval:
BB: 0.5808731 to 0.6315213
X: 0.7022252 to 0.7679907
M: 0.7077068 to 0.7790205
Z: 0.6047899 to 0.6749819
Across all 4 generations, here are some other statistics that are noteworthy:
Minimum: 0.000581 (1)
Maximum: 0.981 (10)
Average: 0.6825534 (0)
Median: 0.72 (10)

Similar to the Danceability averages graph, the generations tend to be grouped. As for Energy, Millennials and Generation X have similar ratings on average. Generation Z and Baby Boomers both tend to be lower than these two generations, but are both similar to each other. Again, the differences in these two groups are statistically significant. The confidence intervals further corroborate this.
Immediately upon analyzing this result, I began to wonder about the connection between Acousticness and Energy. In the description that Spotify provides, death metal is compared to the classical music composer Bach. It seemed that Spotify is implying acousticness and energy are inversely related. Thus, I began to run another correlation test between these two track attributes.
Starting with the Baby Boomer generation, I was surprised to discover that there is not really any relationship between acousticness and energy. The correlation coefficient is 0.04264312 and the p-value is 0.6143.
However, from Generation X forward, the trend reverses. The correlation coefficient between Acousticness and Energy for Generation X music is -0.7923147 and the p-value is < 2.2e-16. As I suspected, there is a high negative correlation between these two attributes. Furthermore, music popularized by Millennials also follows this trend, with r = -0.7402408 and the p-value also being < 2.2e-16. Popular Generation Z music displays the strongest inverse relationship between Acousticness and Energy, with r = -0.8902323 and again, the p-value being < 2.2e-16
Predicts whether a track contains no vocals. “Ooh” and “aah” sounds are treated as instrumental in this context. Rap or spoken word tracks are clearly “vocal”. The closer the instrumentalness value is to 1.0, the greater likelihood the track contains no vocal content. Values above 0.5 are intended to represent instrumental tracks, but confidence is higher as the value approaches 1.0.

95% confidence interval:
BB: -0.000120744 to 0.031927427
X: 0.04969976 to 0.10633132
M: -0.0002476606 to 0.0012080513
Z: 0.02606406 to 0.07883811
Across all 4 generations, here are some other statistics that are noteworthy:
Minimum: 0 (210)
Maximum: 0.855 (1)
Average: 0.04281101 (0)
Median: 1.77e-05 (10)
Despite the stark contrasts between each of the four generations' averages for Instrumentalness, Generation X and Z are not statistically distinct from one another. They both have relatively similar Instrumentalness ratings on average and the confidence intervals overlap greatly. However, Baby Boomers have a significantly lower Instrumentalness score and Millennial music even more so. In short, Generation X and Z are similar in terms of Instrumentalness, Baby Boomers come in third, and Millennials in fourth.
Again, the Spotify description (specifically the "ooh" and "aah" section) for this attribute made me wonder if there was any relationship between Instrumentalness and Speechiness. Preferably, there should be no relationship between these attributes because then, I would think either one or both would be innaccurate.
After doing some correlation tests, it is clear that for most of the generations, there is essentially no relationship between these variables. Many of the p-values were above 0.1, clearly indicating no statistically significant relationship. However, for Generation Z, the p-value = 0.0006935 and r = -0.2748376. Although this suggests a small relationship, it makes me wonder if popular Generation Z music has a lot more filler sounds, like "ooh" and "aah." As of right now, I do not have the data to look into this further.
Mode indicates the modality (major or minor) of a track, the type of scale from which its melodic content is derived. Major is represented by 1 and minor is 0.
95% confidence interval:
BB: 0.7766900 to 0.8993664
X: 0.4753895 to 0.6146105
M: 0.6527202 to 0.8200071
Z: 0.3295224 to 0.4892695
Across all 4 generations, here are some other statistics that are noteworthy:
Minimum: 0 (231)
Maximum: 1 (370)
Average: 0.6156406 (0)
Median: 1 (370)
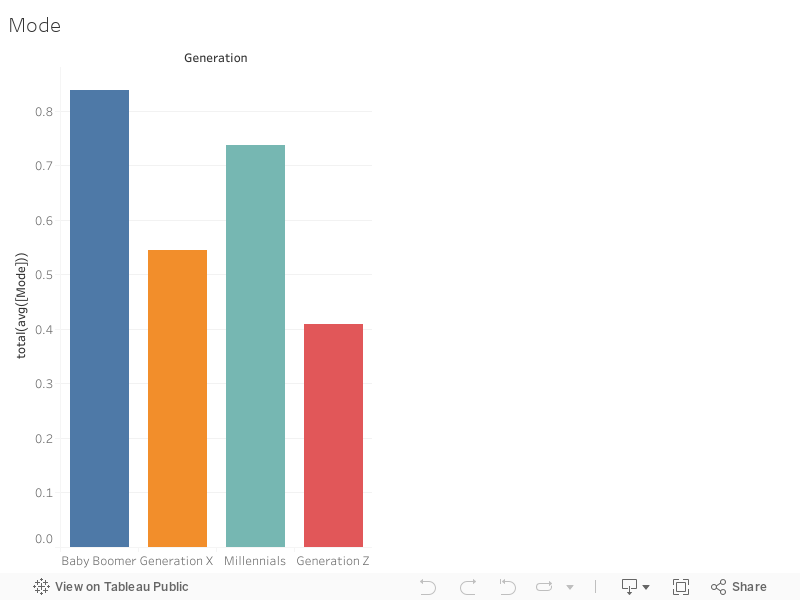
The averages represented in this graph indicate the proportion of songs written in a major key. That being said, it is evident that there each generation is in its own distinct group as far as mode goes. Baby Boomers have the highest proportion of songs written in a major key; far more than the other three generations. Millennials come in with the second-highest, Generation X with the third-highest, and Generation Z with the fourth-highest.
Similar to Duration, there was not anything else that I wanted to look into as far as mode goes. However, I do think it is important to mention that the overall trend seems to be that the number of popular songs written in major key has generally decreased throughout the years. This may be caused by musicans writing songs more about serious or emotional topics. However, I think there were many musicians from every generations that discussed these kinds of topics in their songs; for example, The Beatles, Nirvana, Eminem, and Billie Eilish.
Speechiness detects the presence of spoken words in a track. The more exclusively speech-like the recording (e.g. talk show, audio book, poetry), the closer to 1.0 the attribute value. Values above 0.66 describe tracks that are probably made entirely of spoken words. Values between 0.33 and 0.66 describe tracks that may contain both music and speech, either in sections or layered, including such cases as rap music. Values below 0.33 most likely represent music and other non-speech-like tracks.
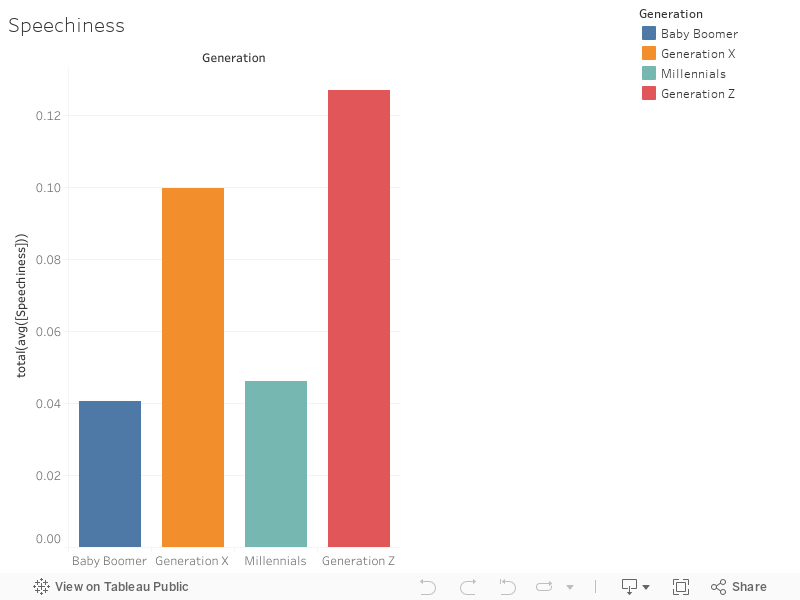
95% confidence interval:
BB: 0.03761935 to 0.04340036
X: 0.08971673 to 0.10981027
M: 0.04319721 to 0.04901915
Z: 0.1111460 to 0.1429238
Across all 4 generations, here are some other statistics that are noteworthy:
Minimum: 0.0254 (1)
Maximum: 0.438 (2)
Average: 0.08270416 (0)
Median: 0.0564 (19)
Although not as clear as in the Mode averages graph, the 4 generations each have distinct Speechiness averages. The confidence intervals corroborate this as there is little to no overlap in each of the four generations. Additionally, as expected, the averages and most of the values are below 0.33, which Spotify suggests is mainly music. Generation Z has the largest Speechiness average, followed by Generation X, Millennials, and last but not least, Baby Boomers.
Speechiness was an attribute that interested me from the beginning of this project. After gathering the 10 albums from each generation, I noticed that the number of rappers included in the final list increased throughout each generation. That being said, I expected Speechiness to steadily increase throughout the 4 generations. However, this was generally not the case. Looking further into the data, I realized that the musicians with the highest Speechiness rating of 0.438 belong to Smashing Pumpkins and R.E.M., both of whom are not self-proclaimed hip-hop artists. Despite this, for the most part, rappers such as Dr. Dre, Eminem, Kanye West, Drake, and Kendrick Lamar do have higher-than-average Speechiness scores.
Average Speechiness Scores:
X: Smashing Pumpkins – 0.119134
X: R.E.M. – 0.1099533
X: Dr. Dre – 0.09469444
M: Eminem – 0.04617
Z: Drake – 0.137716
Z: Kanye West – 0.1312615
Z: Kendrick Lamar – 0.1474
With the exception of Eminem, the rappers all had average Speechiness scores well above average.
As for the fluctuating trend seen in the graph, I looked at each artist's average Speechiness score. Baby Boomers typically had scores around 0.03 to 0.04. Generation X had scores often centered around 0.08 with several artists having averages around 0.1. Millennials had scores consistently averaging around 0.04. Lastly, Generation Z's artists all had Speechiness scores of at least 0.1.
Overall, these results simply represent the presence of spoken words in a track. However, what truly matters is not quantity, but quality.
The overall estimated tempo of a track in beats per minute (BPM). In musical terminology, tempo is the speed or pace of a given piece and derives directly from the average beat duration.
95% confidence interval:
BB: 102.3784 to 111.5822 BPM
X: 130.1459 to 137.4087 BPM
M: 107.1849 to 114.6354 BPM
Z: 109.1462 to 119.3217 BPM
Across all 4 generations, here are some other statistics that are noteworthy:
Minimum: 65.09 (6)
Maximum: 201.96 (1)
Average: 118.4154 (0)
Median: 116.166 (6)
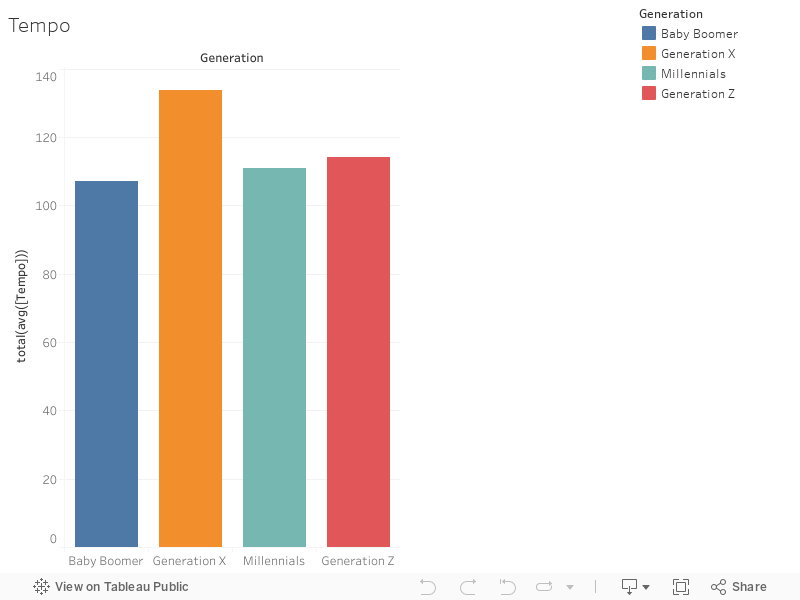
Again, this may not be clear from the chart, but the 4 generations can be split into 3 distinct groups based on Tempo. Generation X clearly has faster songs on average and its confidence interval is much higher than all the other generations. Generation Z has the second fastest songs on average, but its confidence interval overlaps with Millennials. Although their intervals overlap, Generation Z music tends to have faster tempo than Baby Boomers on average. However, there is no statistically significant distnction between the tempo of Millennial and Baby Boomer music.
As stated previously, I will test my hypothesis of Tempo having a parabolic shape when used to predict Danceability. To recap, for Baby Boomers, this relationship is not very strong to begin with, as its r = -0.2303871 and p-value = 0.00581. Generation X displays a stronger relationship between these attributes with its r = -0.3595551 and p-value = 1.705e-07. Millennial music has an even greater relationship with a correlation coefficient of -0.6470702 and p-value of 2.216e-14. However, Generation Z music breaks the trend and its data suggests that there is no significant relationship between these two attributes. Its correlation coefficient is only -0.03936581 and its p-value, 0.6336, is fairly large.
Regardless of the strength of this relationship, all of these generations display an inverse relationship between Tempo and Danceability. Therefore, I am predicting the linear model to be a negative parabola.
Starting with popular Baby Boomer music, I created the model Danceability ~ Tempo. That is, Danceability = Tempo * a + c where a and c are both unknown constants. R printed the summary of this linear model. This linear model has a p-value of 0.00581 and an F-statistic of 7.847 on 1 and 140 degrees of freedom. Clearly, this linear model is useful for using Tempo to predict Danceability. The mathematical equation for this model is Danceability = -0.0008506 * Tempo + 0.5574036. Next, I created the quadratic model, Danceability ~ I(Tempo)^2 * a + c. R stated that this quadratic model has a p-value of 2.745e-11 and an F-statistic of 29.12 on 2 and 139 degrees of freedom. This quadratic model is also useful for using Tempo to predict Danceability. The mathematical equation for this model is Danceability = -0.0000438 * Tempo2 + 0.0098582 * Tempo - 0.0535306. Next, I decided to compare these two models using anova or R's version of a Nested F Test. The results of this test included a p-value of 1.592e-10, indicating that the quadratic model's quadratic term is statistically significant and therefore, the complete model should be used over the reduced. Finally, after confirming that the quadratic model is better to use, the estimate R gives for the quadratic term is indeed negative, albeit small. In summary, this suggests that there is a "peak" tempo for Baby Boomer music that maximizes Danceability and that tempo is 113 BPM for an estimated max Danceability score of 0.501.
I repeated this process with the rest of the generations:
Generation X:
Linear Model: Danceability = -0.0027340 * Tempo + 0.8945102
This model is useful with a p-value = 1.705e-07 and F-statistic of 29.4 on 1 and 198 degrees of freedom.
Quadratic Model: Danceability = -1.246e-05 * Tempo2 + 5.844e-04 * Tempo + 0.6819
This model is also useful with a p-value = 9.238e-07 and F-statistic of 14.92 on 2 and 197 degrees of freedom.
The Nested F Test suggests that the linear model is better at using Tempo to predict Danceability, as the p-value = 0.4723.
Therefore, there does not appear to be any realistic peak tempo that maximizes Danceability.
Millennials:
Linear Model: Danceability = -0.003916 * Tempo + 1.151977
This model is useful with a p-value = 2.216e-14 and F-statistic of 77.79 on 1 and 108 degrees of freedom.
Quadratic Model: Danceability = -3.909e-05 * Tempo2 + 5.606e-03 * Tempo + 0.5918
This model is also useful with a p-value = 1.456e-14 and F-statistic of 43.55 on 2 and 107 degrees of freedom.
The Nested F Test suggests that the quadratic model is better at using Tempo to predict Danceability, as the p-value = 0.01747.
Therefore, there is a suggested peak tempo that maximizes Danceability for Millennial music and that is 71.7 BPM for an estimated
max Danceability score of 0.793.
Generation Z:
Linear Model: Danceability = -0.0001552 * Tempo + 0.5315042
Surprisingly, this model is not useful since its p-value = 0.6336 and F-statistic = 0.2282 on 1 and 147 degrees of freedom.
Quadratic Model: Danceability = -5.935e-05 * Tempo2 + 0.01456 * Tempo - 0.3166
This model, however, is also useful with a p-value = 6.445e-07 and F-statistic of 15.74 on 2 and 146 degrees of freedom.
The Nested F Test suggests that the quadratic model is better at using Tempo to predict Danceability, as the p-value = 1.101e-07.
Therefore, there is a suggested peak tempo that maximizes Danceability for Generation Z music and that is 123 BPM for an estimated
max Danceability score of 0.576.
Note: For the full test outputs, please check the GitHub repository under model_tests.txt. Additionally, all the residuals for the models were 0.18 or less; I find this reasonable.
A measure from 0.0 to 1.0 describing the musical positiveness conveyed by a track. Tracks with high valence sound more positive (e.g. happy, cheerful, euphoric), while tracks with low valence sound more negative (e.g. sad, depressed, angry).

95% confidence interval:
BB: 0.5780253 to 0.6207353
X: 0.346901 to 0.408135
M: 0.6553183 to 0.7412998
Z: 0.3268963 to 0.3929292
Across all 4 generations, here are some other statistics that are noteworthy:
Minimum: 0.0498 (2)
Maximum: 0.966 (8)
Average: 0.4842872 (0)
Median: 0.499 (12)
As seen in previous graphs, the generations tend to be grouped with 2 generations having higher Valence scores and the other 2 with lower Valence scores. Millennials have the highest Valence scores on average, followed by Baby Boomers. However, since the Valence confidence interval for Millennials has no overlap with the Baby Boomers, Millennials have statistically higher Valence on average. After Baby Boomers, Generation X and Z have the two lowest Valence averages. Their confidence intervals have major overlap and they are both much less than the Baby Boomer's interval, suggesting significantly lower Valence scores on average.
Another relationship I wanted to explore was between Tempo and Valence. I think happier sounding songs tend to have faster tempos. Since Spotify has a track attribute called "valence" that is supposed to measure the "positiveness" of a track, I though this would be an appropriate measure to use in relation to tempo to test this theory.
As it turns out, for the Baby Boomer music, this hypotheses generally holds true; upbeat songs are generally more positive than slower songs. The p-value is only 0.0004119 which is much smaller than α = 0.05. However, despite this, the correlation coefficient is only 0.2775954, which only suggests low correlation.
On the other hand, Generation X music is the complete opposite and data suggests that slower songs are more positive than fast songs. The p-value is 6.603e-07 which is significantly smaller than α = 0.05. However, again, the correlation coefficient is -0.3342114 and only infers low correlation.
Millennial music has a similar outcome as Generation X music. The p-value is 3.623e-05 which is also much smaller than α = 0.05 and the correlation coefficient is -0.3691063, suggesting low correlation. All in all, more positive-sounding Millennial music tends to be slower.
As for Generation Z, there appears to be very little correlation between valence and tempo. The p-value is 0.3367 which is not smaller than α = 0.05, so I cannot conclude that valence and tempo are positively related. Additionally, the correlation coefficient is 0.03481944 which again, implies that there is close to no relationship between those two track attributes.
Overarching Themes
Lastly, I tried to look for patterns and relationships among track attributes for the entire set of 601 songs. In order to
answer this, I reviewed each generation's correlation matrix and the correlation matrix of all the data combined.
While there were many relationships between attributes within each generation, there were two pairs of track attributes
that I discovered in the combined correlation matrix: (1) Valence and Danceability and (2) Acousticness and Energy.
The Valence and Danceability pairing had a correlation coefficient of 0.426540564, suggesting moderate correlation, with a p-value less than 2.2e-16. This particular relationship suggests that across these 4 generations, popular music with higher Valence have higher Danceability and vice versa. This trend also appears within each generation, although to varying extents. Baby Boomers displayed a low correlation between these two track attributes with r = 0.3772867 and p-value = 3.685e-06. Generation X showed at moderate correlation with r = 0.4156355 and p-value = 9.341e-10. Millennials should the strongest relationship overall with r = 0.6266014 and p-value = 2.442e-13. On the other hand, Generation Z music had the lowest relationship with r = 0.1931371 and p-value = 0.01828.
The Acousticness and Energy pairing had a correlation coefficient of -0.661279313, suggesting high correlation, with a p-value also less than 2.2e-16. This relationship suggests that across these 4 generations, popular music with higher Acousticness has lower Energy and vice versa. Despite my findings indicating that the Baby Boomer generation displays no relationship between these two attributes, they appear to have a generally strong relationship over time.
Conclusion
Overall, this data analysis project was both fun and challenging. I really enjoyed learning about each of the four generation's
music preferences and explore Spotify's database. In summary, I found Baby Boomer music to be characterized by easy-going tunes with
high levels of acousticness and positiveness. Generation X music has a lot of rock elements such as high levels of instrumentalness,
faster tempo, and lower levels of Valence. Millennial music tends to be extremely energetic and in turn, very "danceable" and
happy-sounding — exuding the birth of true pop music. Last, but not least, Generation Z music was in a league of its own as it
oftentimes didn't share the same trends as the other 3 generations. However, I would describe my generation's music to be heavily
influenced by rap where speech and the music/beat balance each other out and overall, tends to be more brooding (for a lack of a
better term).
However, despite the results, I would like to gain some more clarity on how Spotify rates and describes each attribute. Although looking through all of the data they have created and gathered was interesting, I disagreed with some of my results and found the descriptions for some of the attributes to be vague. For instance, I thought Instrumentalness would be significantly higher for Baby Boomers and lower for Generation Z. Moreover, the description for this attribute includes "ooh" and "aah" sounds as instruments. I disagree with that portion of the description since many pop songs use "ooh" and "aah" as repetitive sounds to fill the gaps in lyrics. Additionally, while Speechiness is divided into different sections (for example: music, "spoken" music, and podcasts), I think it makes this attribute more confusing and possibly harder to gauge. On a different note, I think many of the attributes overlap. For instance, Energy implicitly states in its description that lower Acousticness equates to higher Energy. Again, I think this "codependency" may make it harder to analyze music using Spotify's database. I assume that Spotify has a program that "listens" to every track that is uploaded to their platform and due to these vague descriptions, so I think there is more error in this database than one might expect.
Analyzing music is a tricky task and of course, could upset many music lovers. Again, music is subjective; numbers cannot justify or quantify music. However, despite these flaws in Spotify's database it was truly an enjoyable experience and the results that I have found are purely to fuel my intellectual curiousity.